The Market Yield on U.S. Treasury Securities at 10-Year Constant Maturity is a critical financial metric that reflects the yield or interest rate on a hypothetical U.S. Treasury security with a fixed maturity of 10 years. It serves as a benchmark for long-term interest rates and provides valuable insights into the overall health of the economy, credit markets, and investor sentiment.
In this article, we’ll take a closer look at the Market Yield on 10-Year U.S. Treasury Securities from 2018 up to today. We’ll explore the ups and downs in the data to understand what’s happening behind the scenes. By digging into this information, we hope to give you a clear picture of the factors that affect the Market Yield on 10-Year U.S. Treasury Securities and what it means when the yield goes up or down.
What are U.S. Treasury securities?
Let’s start by first understanding what U.S. Treasury securities are. U.S. Treasury securities are debt instruments issued by the United States Department of the Treasury to fund the federal government’s operations, public projects, and programs. These securities are considered one of the safest investments in the world because they are backed by the full faith and credit of the U.S. government. Investors lend money to the government by purchasing Treasury securities, and in return, the government pays interest over a specified period.
There are several types of U.S. Treasury securities, including:
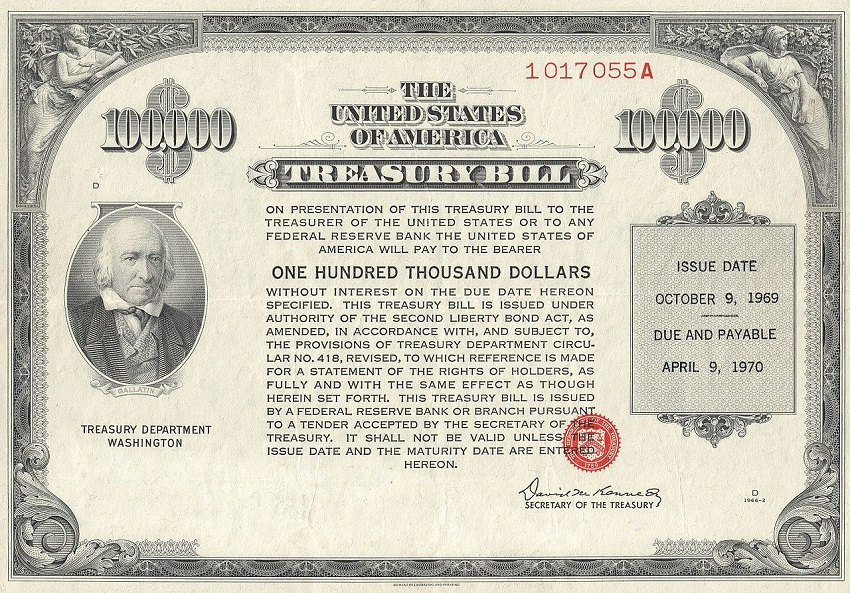
- Treasury bills (T-bills): Short-term debt instruments with maturities ranging from a few days to 52 weeks. They are sold at a discount to their face value and do not pay interest before maturity. Instead, investors earn a return based on the difference between the purchase price and the face value at maturity.
- Treasury notes (T-notes): Medium-term debt instruments with maturities of 2, 3, 5, 7, or 10 years. T-notes pay interest semi-annually and have a fixed face value. The return on investment depends on the interest rate and the purchase price.
- Treasury bonds (T-bonds): Long-term debt instruments with maturities of 20 or 30 years. Like T-notes, T-bonds pay interest semi-annually and have a fixed face value.
- Treasury Inflation-Protected Securities (TIPS): These are similar to T-notes and T-bonds but are designed to protect investors from inflation. The principal value of TIPS is adjusted based on changes in the Consumer Price Index for All Urban Consumers (CPI-U). Interest payments are calculated on the inflation-adjusted principal, so they increase with inflation and decrease with deflation.
- Floating Rate Notes (FRNs): These are debt instruments with a variable interest rate that is adjusted periodically based on a reference rate, such as the 13-week T-bill rate. FRNs have a maturity of two years and pay interest quarterly.
U.S. Treasury securities are popular among investors due to their safety, liquidity, and wide range of maturities. They are also exempt from state and local income taxes, making them attractive to investors in high-tax states.
What is the Market Yield on U.S. Treasury Securities at 10-Year Constant Maturity?
Market Yield on U.S. Treasury Securities at 10-Year Constant Maturity” is a financial metric that tracks the yield or interest rate on a hypothetical U.S. Treasury security with a fixed maturity of 10 years. It is derived from the actual market prices of U.S. Treasury securities with different maturities, and it is used as a benchmark to gauge the overall health of the economy, credit markets, and interest rate environment.
The yield on the 10-year Treasury note is of particular importance to investors and policymakers because it serves as a key indicator of long-term interest rates and investor sentiment. It is often used as a reference rate for various financial instruments, such as mortgage loans and corporate bonds, as well as a basis for comparing the performance of different investments.
Factors influencing the 10-year constant maturity yield
The 10-year constant maturity yield is influenced by various factors, including:
- Monetary policy: Changes in the Federal Reserve’s monetary policy, such as raising or lowering the federal funds rate, can affect the yield on 10-year Treasury securities.
- Inflation expectations: If investors anticipate higher inflation in the future, they will demand higher yields on their investments to protect their purchasing power, causing the yield on 10-year Treasury securities to rise.
- Economic conditions: Strong economic growth can increase the demand for credit, causing long-term interest rates to rise. Conversely, weak economic growth can lead to lower interest rates.
- Market sentiment: Investors often turn to U.S. Treasury securities as a “safe-haven” investment during times of market uncertainty or turmoil, driving down yields. Conversely, when investor sentiment is positive, they may seek higher-yielding assets, causing Treasury yields to rise.
- Supply and demand: The supply and demand dynamics for Treasury securities can also impact the yield. An increase in the supply of Treasury securities, such as through increased government borrowing, can cause yields to rise, while increased demand can cause yields to fall.
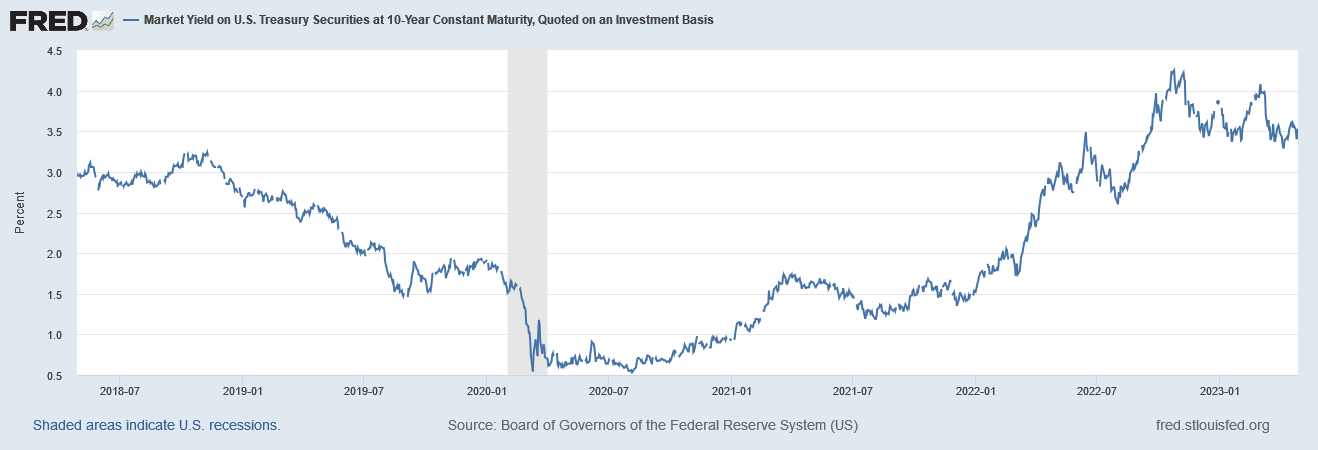
Market Yield on U.S. Treasury Securities at 10-Year Constant Maturity April 2018 – April 27 2023
| DATE | Market Yield (%) |
| 2018-04-27 | 2.96 |
| 2018-05-01 | 2.97 |
| 2018-06-01 | 2.89 |
| 2018-07-02 | 2.87 |
| 2018-08-01 | 3 |
| 2018-09-04 | 2.9 |
| 2018-10-01 | 3.09 |
| 2018-11-01 | 3.14 |
| 2018-12-03 | 2.98 |
| 2019-01-02 | 2.66 |
| 2019-02-01 | 2.7 |
| 2019-03-01 | 2.76 |
| 2019-04-01 | 2.49 |
| 2019-05-01 | 2.52 |
| 2019-06-03 | 2.07 |
| 2019-07-01 | 2.03 |
| 2019-08-01 | 1.9 |
| 2019-09-03 | 1.47 |
| 2019-10-01 | 1.65 |
| 2019-11-01 | 1.73 |
| 2019-12-02 | 1.83 |
| 2020-01-02 | 1.88 |
| 2020-02-03 | 1.54 |
| 2020-03-02 | 1.1 |
| 2020-04-01 | 0.62 |
| 2020-05-01 | 0.64 |
| 2020-06-01 | 0.66 |
| 2020-07-01 | 0.69 |
| 2020-08-03 | 0.56 |
| 2020-09-01 | 0.68 |
| 2020-10-01 | 0.68 |
| 2020-11-02 | 0.87 |
| 2020-12-01 | 0.92 |
| 2021-01-04 | 0.93 |
| 2021-02-01 | 1.09 |
| 2021-03-01 | 1.45 |
| 2021-04-01 | 1.69 |
| 2021-05-03 | 1.63 |
| 2021-06-01 | 1.62 |
| 2021-07-01 | 1.48 |
| 2021-08-02 | 1.2 |
| 2021-09-01 | 1.31 |
| 2021-10-01 | 1.48 |
| 2021-11-01 | 1.58 |
| 2021-12-01 | 1.43 |
| 2022-01-03 | 1.63 |
| 2022-02-01 | 1.81 |
| 2022-03-01 | 1.72 |
| 2022-04-01 | 2.39 |
| 2022-05-02 | 2.99 |
| 2022-06-01 | 2.94 |
| 2022-07-01 | 2.88 |
| 2022-08-01 | 2.6 |
| 2022-09-01 | 3.26 |
| 2022-10-03 | 3.67 |
| 2022-11-01 | 4.07 |
| 2022-12-01 | 3.53 |
| 2023-01-03 | 3.79 |
| 2023-02-01 | 3.39 |
| 2023-03-01 | 4.01 |
| 2023-04-03 | 3.43 |
| 2023-04-27 | 3.53 |
From the data presented, it is evident that the Market Yield on 10-Year U.S. Treasury Securities has experienced significant fluctuations during the period from 2018 to 2023. The yield began at 2.96% in April 2018 before declining to 1.65% in October 2019, followed by a sharp drop to 0.62% in April 2020, largely due to the COVID-19 pandemic and the Federal Reserve’s accommodative monetary policy response.
In April 2021, the yield rebounded to 1.69% as the economy began to recover, and vaccinations were rolled out on a large scale. The Market Yield continued its upward trajectory in 2022, reaching 4.07% in December 2022 as economic growth accelerated, inflationary pressures increased and interest rates rose. As of April 27, 2023, the yield has declines slightly to 3.53%, reflecting market participants’ expectations for slower economic growth or lower inflation in the future and expectations that the Federal Reserve will maintain or adopt a more accommodative monetary policy stance, such as keeping interest rates lower than today.